You know the ritual: mark the prior day and week, box the sessions, find equilibrium, then do it all again tomorrow. LodeStone puts the whole map on the chart the moment it loads. Session extremes, value, structure and SMT, built on ICT concepts for index futures.
Build V7.5ICT session levelsSMT divergenceNQ · ES · YMNothing repaints
Prior day high and low, the weekly levels, Asia and London extremes, value area, equilibrium. Twenty minutes of drawing before the first real decision, and one mismarked level can cost the trade.
→
Where LodeStone puts you
The map is up before you are.
LodeStone drops the full session map automatically and keeps it current as the day builds. You open the chart to levels you trust and spend the open deciding, not drawing.
Watch it work
The map draws itself.
Load the chart and the framework appears: prior levels pinned, sessions boxed, value and equilibrium marked, price threading through it all.
LodeStone / auto-draw
What's inside
The toolkit on the chart.
One indicator carries the whole framework. Levels, value, structure and divergence, labeled and current, so nothing important hides off screen.
Sessions
The session map
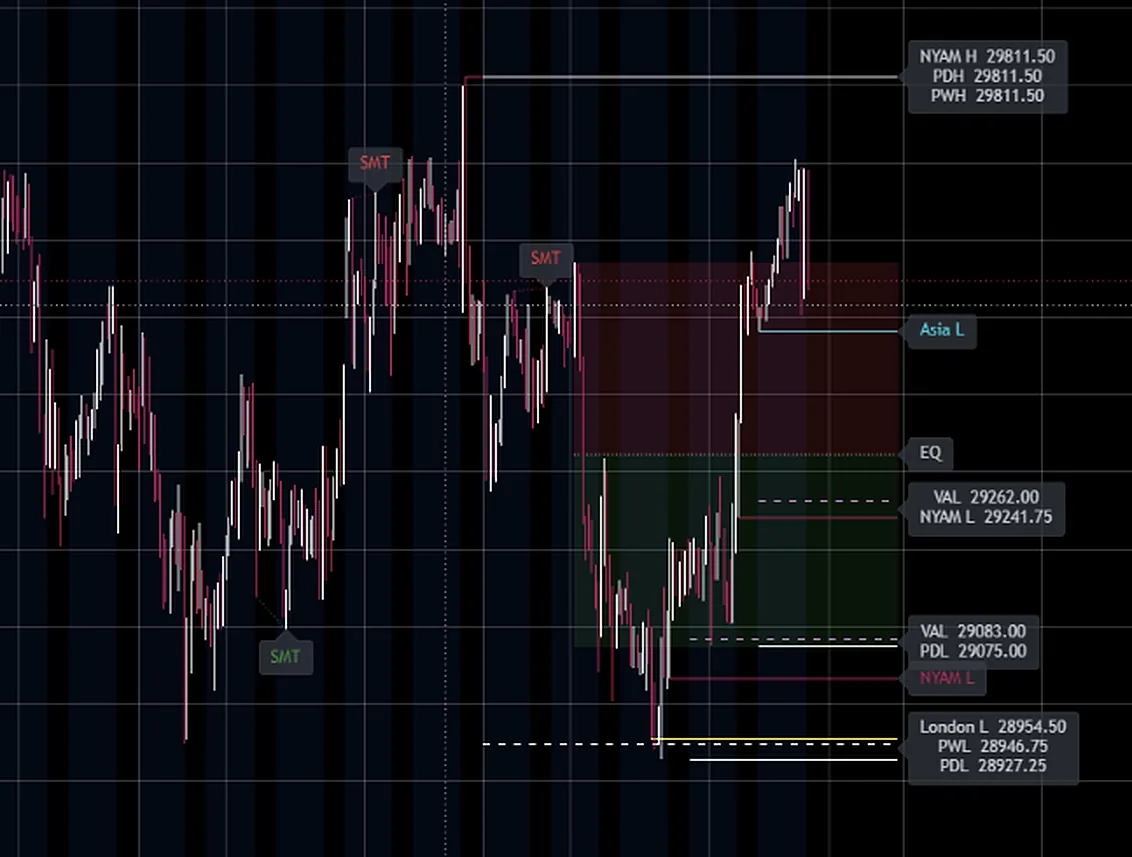
Asia, London and New York AM and PM highs and lows are marked and labeled as each session hands off to the next, so you always know which pool of liquidity is in play.
Prior
Yesterday and last week
PDH, PDL, PWH and PWL stay pinned to the chart, so the levels the market keeps coming back to are never something you forgot to draw.
Value
Value and equilibrium
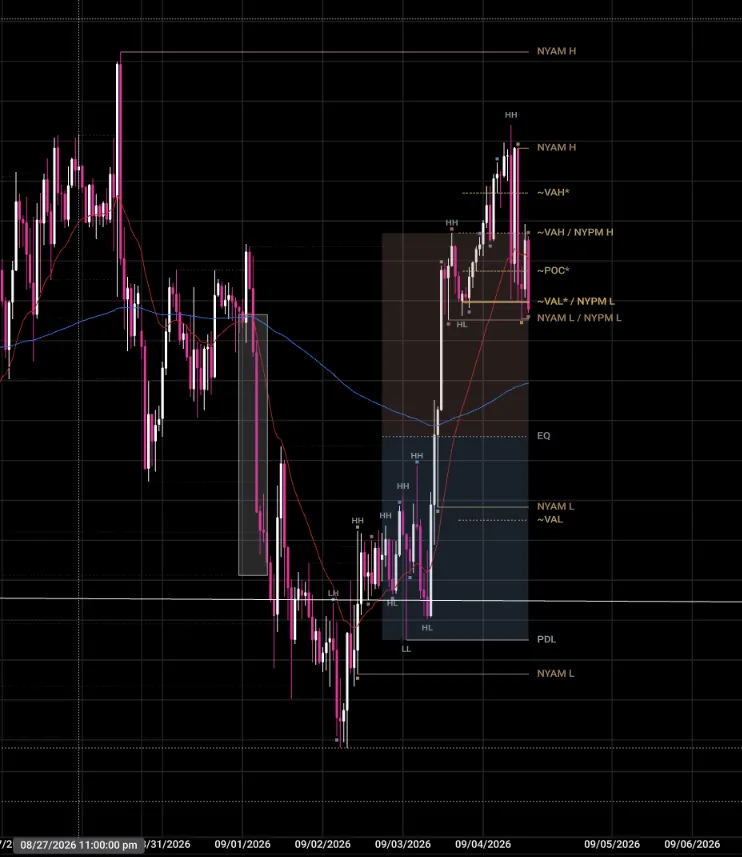
Value area high and low, point of control and the equilibrium of the range, so premium and discount are visible the second you look at the chart.
SMT
Structure and divergence
Swing labels track HH, HL, LH and LL as structure builds, and SMT flags mark the moments the indices stop agreeing with each other.
Liquidity
Resting liquidity
Relative equal highs and lows are flagged where they form, the pools price tends to reach for before it turns, so you see the draw before the run at it.
Volume
A restrained volume profile
Daily point of control and value area, drawn as clean levels instead of a histogram, so volume context lands without burying the candles.
A look inside
On the chart, not in the way.
LodeStone / sessions
Session extremes, prior levels, value and SMT flags, all labeled at the right edge
LodeStone / structure
Structure labels, equilibrium and the value map as the week builds
Every line, defined
What LodeStone draws.
The full vocabulary of the chart, so you know exactly what each label means the first time you load it.
NYAM H / L
New York morning session high and low
NYPM H / L
New York afternoon session high and low
Asia H / L
Asia session extremes, marked overnight
London H / L
London session extremes into the New York open
PDH / PDL
Prior day high and low
PWH / PWL
Prior week high and low
VAH / VAL
Value area high and low for the profile period
POC
Point of control, the price with the most traded volume
EQ
Equilibrium of the dealing range
Premium / Discount
Shaded zones above and below equilibrium
Rel. equal H / L
Resting liquidity where swings match within your tolerance
SMT
Divergence flag when correlated indices stop agreeing
HH · HL · LH · LL
Structure labels as each swing confirms
Swept levels
Removed or faded automatically once price takes them
Under the hood
Your rules, your levels.
LodeStone maps the framework, but you decide how it trades with you. Every module has a switch and every level has a dial.
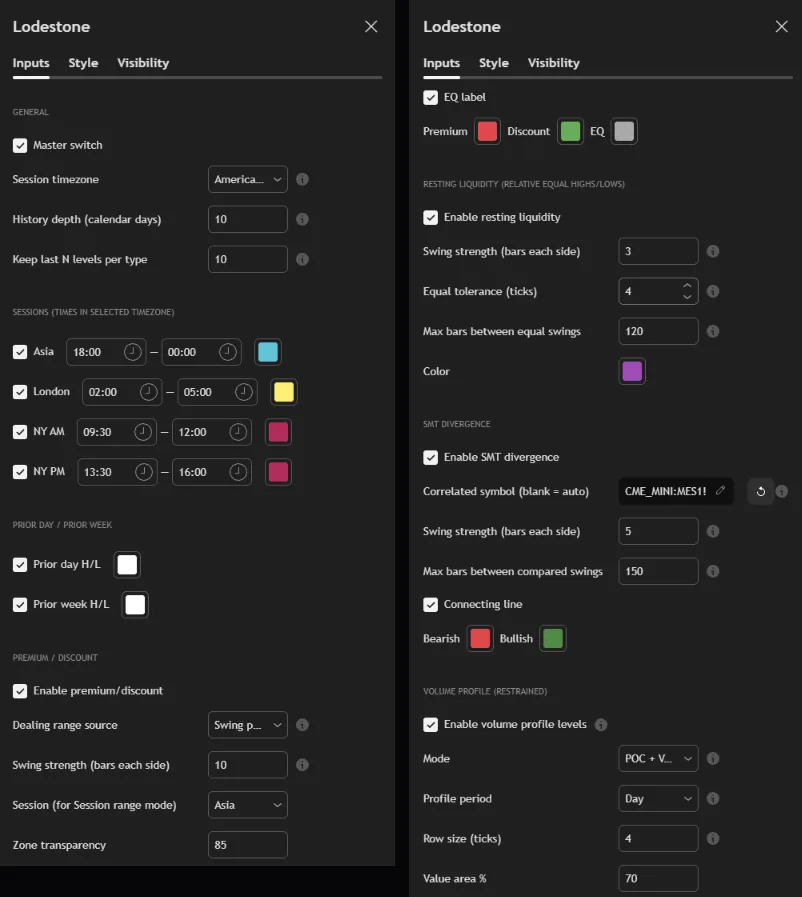
Sessions on your clock. Set the timezone and the exact windows for Asia, London, NY AM and NY PM, each with its own color.
Draw only what you trade. Prior levels, premium and discount, resting liquidity, SMT and the volume profile all toggle independently.
Tune the signal. Swing strength, equal-high tolerance, value area percent, label size and extension are all yours to set.
Nothing repaints. Levels and flags print and stay. What you see in review is what you would have seen live.
A self-cleaning chart. When price sweeps a level, LodeStone removes or fades it, so the map stays current instead of stacking clutter.
LodeStone / inputs · TradingView
Get LodeStone
One indicator. Two platforms.
Same toolkit either way. Pick the platform you actually chart on.
Tradovate
$149
One time · yours for good
One purchase, no subscription, nothing to cancel
The indicator file ships to your checkout email
Load it into Tradovate and the map is on your chart
Checkout runs through Stripe. Delivery help and questions live in the #korvus-indicator channel on the BlackCrown Discord. Already a Korvus Operator at korvus.industries? The TradingView indicator is included with your subscription.
Questions
Before you buy.
How does delivery work on Tradovate?+
After checkout the indicator file ships to the email you used at checkout. Load it into Tradovate and the map is on your chart. One purchase, yours for good, nothing to cancel.
How does access work on TradingView?+
TradingView runs as a monthly subscription. After checkout, access is granted through the BlackCrown Discord in the #korvus-indicator channel. Cancel anytime. It is also included at no extra cost with a Korvus Operator subscription.
What markets is it built for?+
Index futures first: NQ, ES and YM, and the micros that track them. The session map, value logic and SMT comparisons are tuned to how the indices trade.
Can I control what it draws?+
Yes. Every module has its own switch and the inputs are yours: session windows and timezone, swing strength, tolerances, value area percent, colors, labels and how swept levels are cleaned up.
Where do I get help?+
The #korvus-indicator channel on the BlackCrown Discord covers delivery, setup and questions. Email works too: BlackCrownVxJ.LLC@outlook.com.
TRUE NORTH // FOUND
Stop drawing. Start deciding.
LodeStone runs on the same desk that built Korvus and trades these levels every session. Put the map on your chart tonight.